
Under baseline assumptions, approximately 59% of all transmission came from asymptomatic transmission: 35% from presymptomatic individuals and 24% from individuals who are never symptomatic (Figure 1). Because each component is uncertain, we assessed different timings of peak infectiousness relative to illness onset and different proportions of transmission from individuals who never have symptoms. Maintaining the 24% of transmission from individuals who never have symptoms, but shifting peak infectiousness 1 day earlier (to day 4) increased presymptomatic transmission to 43% and all asymptomatic transmission to 67% (Figure 1A). A later peak (ie, day 6) decreased presymptomatic to 27% and all asymptomatic transmission to 51% (Figure 1C).
Holding the day of peak infectiousness constant at day 5 and decreasing the proportion of transmission from individuals who are never symptomatic to 10% with a relative infectiousness of 75% (baseline assumption), the proportion of all transmission from those who are never symptomatic decreased to 8%, presymptomatic transmission increased to 42%, and combined asymptomatic transmission was 50% of all transmission (Figure 1D). In contrast, if the proportion of those who ever develop symptoms was 30% and their relative infectiousness increased to 100%, they contributed 30% of all transmission, presymptomatic transmission was 32%, and combined asymptomatic transmission was 62% of all transmission (Figure 1F).
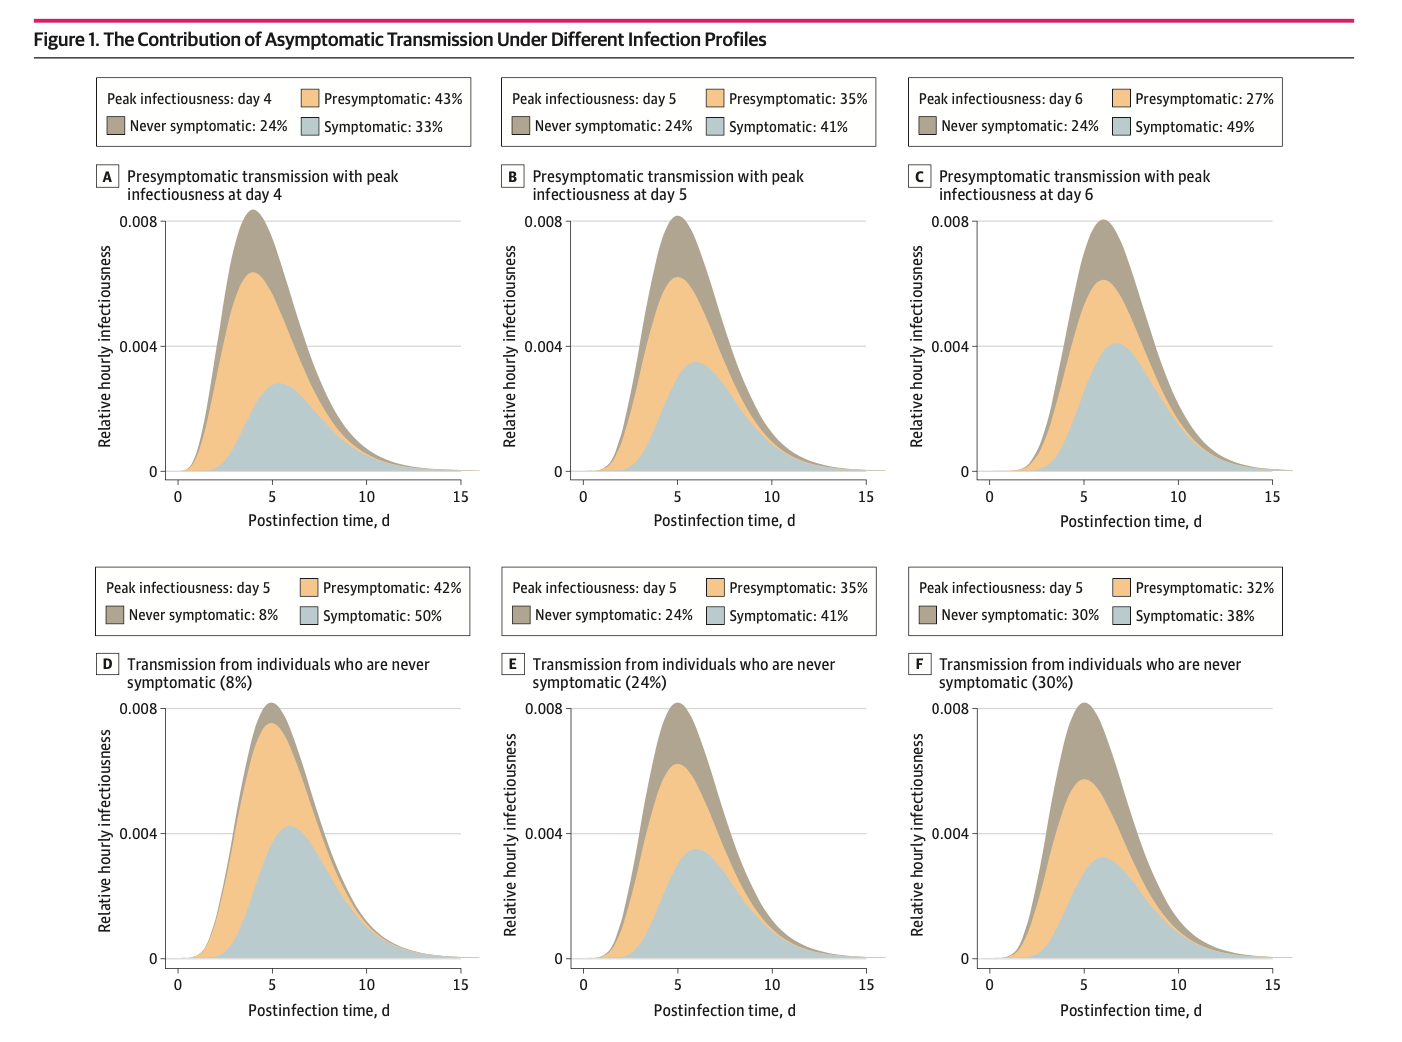
Figure Illustration
The top curve in each panel represents the average relative hourly infectiousness, such that while the lower curves change under different assumptions, the total hourly infectiousness equals 1 in all cases. Within each curve, the colored area indicates the proportion of transmission from each class of individuals. The portion attributed to individuals with symptoms (light blue) can also be interpreted as the maximum proportion of transmission that can be controlled by immediate isolation of all symptomatic cases. Panels A, B, and C show different levels of presymptomatic transmission. We calibrated infectiousness to peak at day 4 (A), 5 (B; median incubation period), or 6 (C) days. Panels D, E, and F show different proportions of transmission from individuals who are never symptomatic: 8% (C; eg, 10% never symptomatic and 75% relative infectivity), 24% (D; baseline, 30% never symptomatic and 75% relative infectivity), and 30% (E; eg, 30% never symptomatic and 100% relative infectivity).


Copyright © JiaXing ZhengQun Medical Devices Co.,Ltd. All Rights Reserved. China Medical Devices Companies

 English
 简体中文
简体中文